
Indian Ocean Dipole
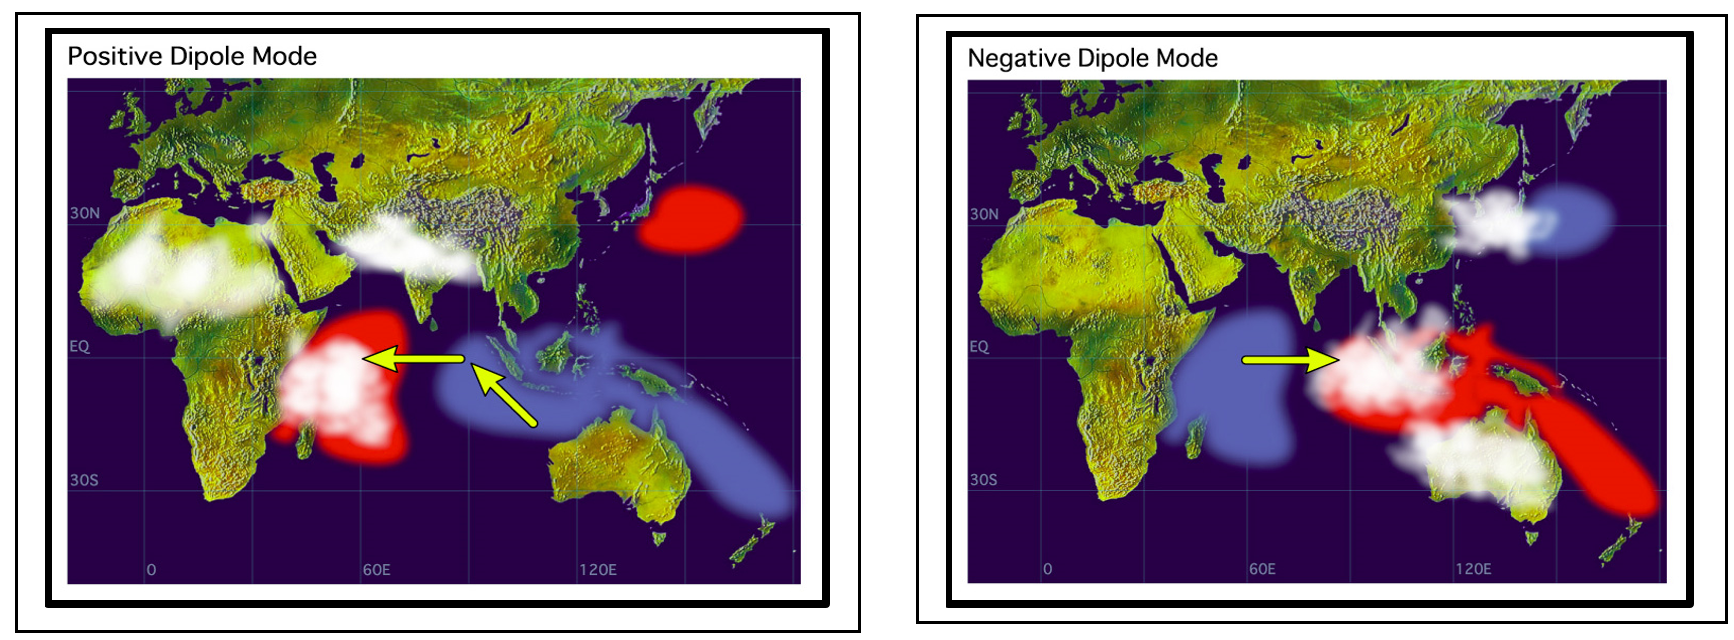
The Indian Ocean Dipole (IOD), like ENSO, involves two areas or poles around which sea surface temperatures oscillate. One is in the western Indian Ocean near east Africa, the other in the eastern Indian Ocean near the west Australian coast south of Indonesia. Under a positive IOD warm water sits on the western side of the Indian Ocean and triggers increased evaporation and rising air columns cause increased rainfall in east Africa. At the same time cold water is over the east side of the Indian Ocean which is beneficial for fisheries but not for rainfall, so drought may ensue in Indonesia and Australia. A negative IOD is the reverse of this.
The sea surface temperature anomalies are shaded (red for warm and blue for cold). The white patches indicate increased convection of clouds and rainfall, and the arrows indicate anomalous wind directions during IOD events.
Source: https://www.jamstec.go.jp/aplinfo/sintexf/e/iod/about_iod.html
The Tokyo Climate Center describes the IOD as follows:
JMA uses the dipole mode index (DMI) to monitor IOD events. The DMI is based on differences in area-averaged monthly-mean SST deviations between the tropical western Indian Ocean [50 - 70ºE, 10 ºS- 10ºN] (denoted as the WIN area in Figure 2) and the southeastern tropical Indian Ocean [90 - 110ºE, 10ºS - Equator, with monthly-mean SST deviation based on linear extrapolation with respect to the latest sliding 30-year mean for each calendar month.
Positive and negative IOD events generally both occur in boreal summer and autumn (from June through November). Positive (negative) IOD events are identified when the three-month running mean DMI is +0.4ºC or above (-0.4ºC or below) for at least three consecutive months between June and November. The data used here are JMA's COBE-SST.
There appears to be a link between the Indian Ocean Dipole and ENSO in the Pacific Ocean through the currents which carry water west through Indonesia from the Pacific to the Indian Ocean via the Walker Circulation (http://www.bom.gov.au/climate/enso/history/ln-2010-12/IOD-what.shtml). When the two coupled ocean and atmospheric circulations are in phase (synchronized) the impacts can be severe on Australia, but are weaker when not in phase (ibid).
The Tokyo Climate Center subscribes to a different view saying the IOD is “independent of El Nino/La Nina phenomena” (https://ds.data.jma.go.jp/tcc/tcc/products/elnino/iodevents.html). The table below suggests that sometimes the IOD and El Nino/La Nina coincide and sometimes they do not.
Dipole Mode Index (DMI) time series representation
The thin and thick lines indicate monthly mean and three-month running mean DMI, respectively, while red and blue shading denotes positive and negative IOD periods, respectively. Hatched areas indicate positive and negative IOD events in concurrence with El Niño and La Niña events, respectively. These events were excluded in the statistical surveying of composite maps for IOD and IOD impacts on the global climate.
