
Global Trends in Greenhouse Gases
There are a number of so-called ‘greenhouse gases’ (GHG) which contribute to global warming through trapping heat in the earth’s atmosphere. The main ones are carbon dioxide (CO2), methane, nitrous oxide, and ozone. Water vapour and certain chemicals such as chlorofluorocarbons (CFCs) also play a role. While methane, for example, is some 28 times more potent a GHG than CO2, there is much less of it in the atmosphere. CO2 accounts for about three-quarters of GHGs.
Global Trends in Carbon Dioxide (CO2)
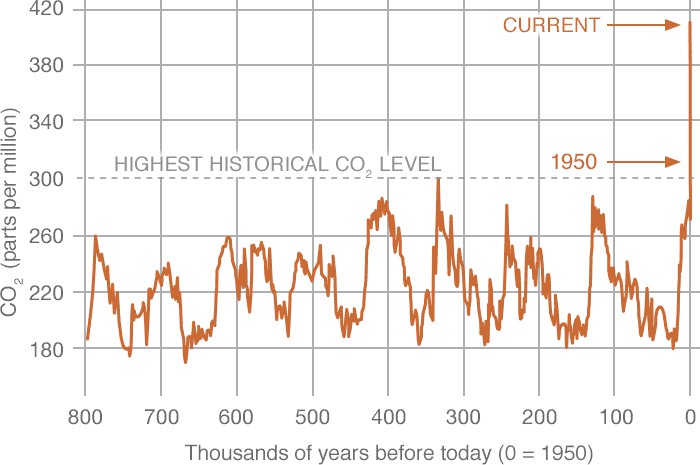 Evidence from ice cores in Antarctica (Vostok base and Dome C) CO2 levels have fluctuated over the past three glacial cycles (800,000 years) from lower levels around 180 parts per million (ppm) during the Ice Ages, then rising to around 280 ppm in the Interglacial periods.
The trend of CO2 is known very precisely over the past 6 decades thanks to Charles Keeling of the Scripps Institution of Oceanography who established a NOAA monitoring station at 13,680 feet (3,400 m) elevation on the inactive Mauna Loa volcano in Hawaii in 1958. This remote location was as far from sources of industrial CO2 as was possible at the time. The so-called Keeling Curve (www.keelingcurve.ucsd.edu) shows the steady rise in atmospheric CO2 from that point to the present. The full data can be obtained from NOAA, which has run parallel measurements through its Earth System Research Laboratory (ESRL) since 1974. Of course, due to the location and elevation, these data may not represent the globally averaged CO2 concentration at the surface.

Source: gml.noaa.gov/ccgg/trends/
The first graph shows the steep upward and gradually accelerating trend in CO2 levels from 1958 to 2021. The second graph focuses in the past 6 years to shows the natural annual fluctuation due to the seasons. Mauna Loa site is roughly on the Tropic of Cancer (21 degrees north of the equator) so experiences an end of calendar year winter where the absorption of atmospheric CO2 by trees and other vegetation is reduced, and CO2 levels rise, peaking around April-May, then the arrival of spring and summer bring the trees to life and much CO2 is absorbed again, lowering the global level by about 6 ppm by Fall in September, when the cycle is repeated.
There are other CO2 monitoring stations, such as Cape Grim, in Tasmania, Australia (classified as one of three WMO global super-stations), which has operated since 1976, during which period CO2 levels have increased by more than 20% (www.bom.gov.au/inside/cgbaps/), similar to the 24% at Mauna Loa in that period. This station in northwest Tasmania, is exposed to ‘clean air’ carried by the “roaring forties” across the Southern Ocean to the station.
The Cape Grim station has contributed recent evidence to support ice core data showing that the decline in the ratio of carbon-13 isotypes (d13C) that has accompanied increasing CO2 trends indicates that the sources are fossil fuel and land-use changes (ecos.csiro.au/cape-grim/).
Global Trends in Methane
 Methane trends are included here because, as mentioned, it is a more powerful GHG than CO2 (25 times the global warming potential of CO2), if less present. However, as the northern hemisphere warms, and the Arctic regions warm even more rapidly, vast areas of permafrost are subject to melting, and releasing their massive stores of methane into the atmosphere.
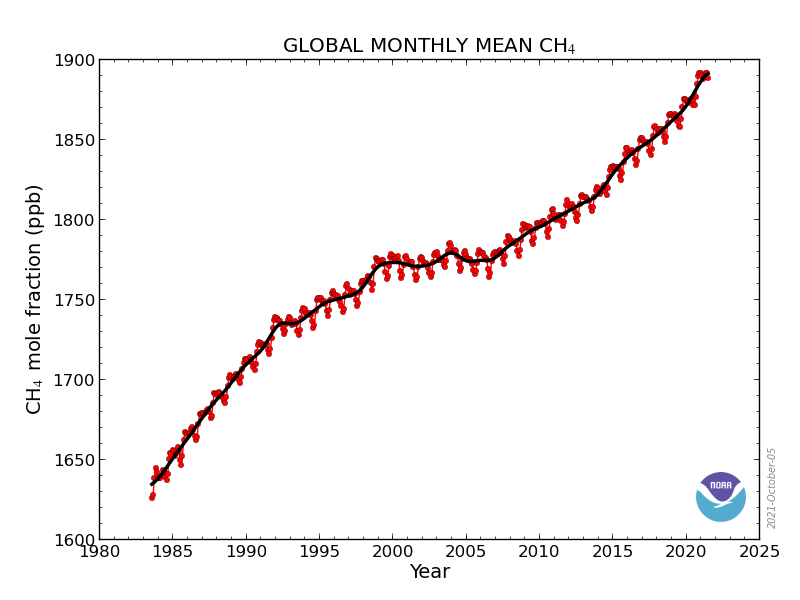
Unlike CO2 monitoring at Mauna Loa, methane has been monitored since 1983 by the Global Monitoring Division of NOAA’s ESRL at a globally distributed network of air sampling sites (Ed Dlugokencky, NOAA/GML (gml.noaa.gov/ccgg/trends_ch4/)).
CO2 levels are normally reported in parts per million, but methane is reported in parts per billion (ppb). The past 35 years have seen a global increase of about 16% (1650 in 1985 to 1888.8 in June 2021) (ibid) with an acceleration since 2007, and an annual increase of 15.42 in 2020, the highest recorded.
Global Trends in Nitrous Oxide and Fluorinated Gases
Nitrous Oxide is emitted into the atmosphere from changes in land use, agricultural and industrial activities, and use of fossil fuels, as well as wastewater treatment (epa.gov/ghgemissions/ overview-greenhouse-gases).
 It’s global warming potential is some 300 times greater than CO2.
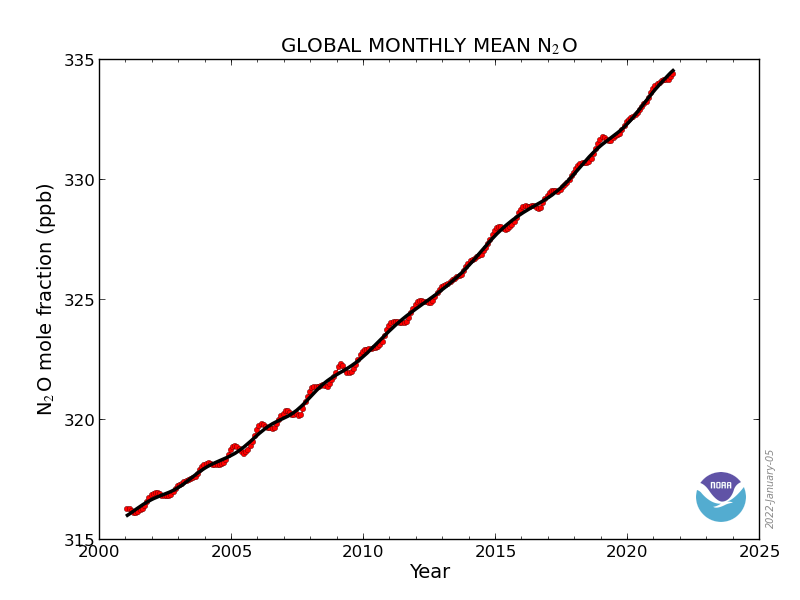
NOAA’s ESRL Global Monitoring Laboratory has also been monitoring nitrous oxide since 2001 during which time concentrations have increased some 5% from 316 to 334.2 parts per billion in June 2021. The annual increments have basically doubled over that period to 1.37 in 2020
(Ed Dlugokencky, NOAA/GML (gml.noaa.gov/ccgg/trends_n2o/)).
The same NOAA/GML source provides monitoring of one of the main ozone depleting gases, in particular Sulphur Hexafluoride (SF6), which has increased steeply from about 4 in 1997 to 10.62 parts per trillion in June 2021. These gases have no natural source but derive from various industrial processes. These fluorinated gases tend to be in low concentrations but can be extremely powerful GHGs (22,800 the global warming potential compared to CO2), and remain in the atmosphere for thousands of years (SF6 has a lifetime of 3,200 years).
Source: (epa.gov/ghgemissions/overview-greenhouse-gases).