
Sources: World Meteorological Organization [https://public.wmo.int/en]
The world’s first dedicated weather satellite, the Television Infrared Observation Satellite (TIROS-1) was launched by the US some 6 decades ago (April 1, 1960). This formed the basis of the World Meteorological Organization’s (WMO) World Weather Watch Programme.
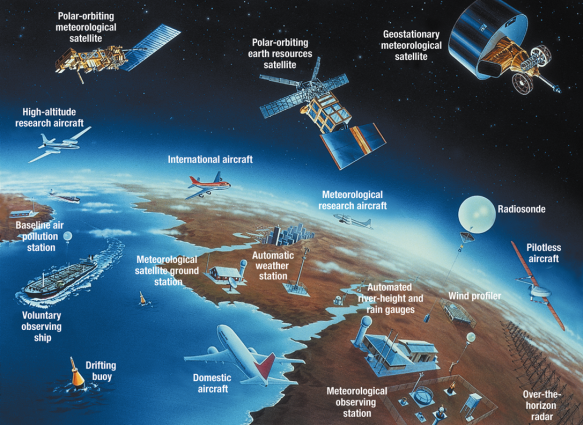
The World Weather Watch consists of three components: the Global Observing System (GOS), the Global Telecommunications System (GTS) and the Global Data-processing and Forecasting System (GDPFS). The GOS consists of a “multitude of individual surface- and space-based observing systems owned and operated by a plethora of national and international agencies …” [https://public.wmo.int/en/programmes/global-observing-system].
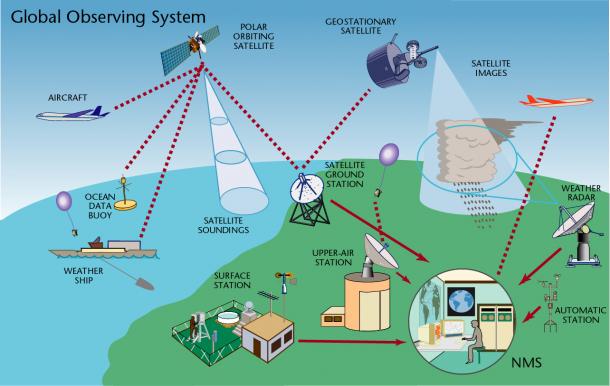 The components of the GOS belong to the National Meteorological and Hydrological Services of WMO Members, to other national and international agencies such as space agencies or to private entities [ibid].
Meteorological and hydrological ground-based observations are collected by the World Meteorological Organization (WMO) through a global network of over 10,000 manned and automatic surface weather stations[1], 1,000 upper air stations, each with a unique ID code. Rainfall and temperature data provided by the WMO stations are considered most accurate closer to these station locations. These station locations then allow for data drilling of individual ones or a collection of stations to explore agrometeorological data spatially and temporally. The data collected by these ground stations are interpolated on a 5 km grid for visualization and analysis.
[https://www.arcgis.com/home/item.html?id=c3cbaceff97544a1a4df93674818b012]
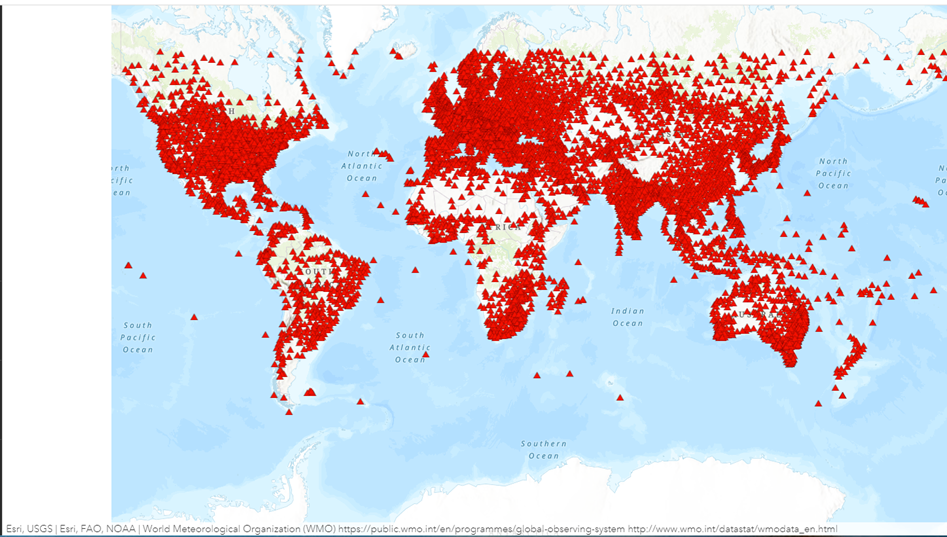 It is clear from the accompanying illustration of WMO ground stations that there are massive concentrations in certain parts of the world, with gaps in other parts of the world, such as DR Congo, parts of the Sahara region in Africa, but of great importance at this time, are the higher latitudes – the Arctic and Antarctica.
In addition to the 10,000+ land stations, there are around 7,000 ships making standard surface observations throughout the world. About one-tenth of the land stations and a few of the ships make upper-air observations; these observations are complemented by 3,000 specially equipped commercial aircraft measuring key parameters of the atmosphere, land and ocean surface every day. There are also 30 meteorological and 200 research satellites collecting cloud observations from geostationary and polar-orbiting locations.
[https://public.wmo.int/en/bulletin/pioneering-collection-and-exchange-meteorological-data] and [https://public.wmo.int/en/our-mandate/what-we-do/observations].
For upper atmosphere meteorological observations one of the oldest and simplest devices is the weather balloon, or radiosonde. Every day, twice a day, weather balloons are released from 900 locations worldwide. They can rise to 100,000 feet (about 20 miles) into the atmosphere, remaining up for two hours during which they might drift up to 125 miles (200 kms). A transmitter sends back data on air temperature, relative humidity every one or two seconds, which along with location allows the calculation of wind speed and direction
Since the establishment of the World Weather Watch a network of about 4,000 Argo drifting buoys has been established. The buoys have a life of about 5 years on battery power, and drift across the oceans and sink stepwise to a depth of 2,000 metres then rise to the surface every 10 days to transmit their current location and the past 10 days of observations on depth, ocean temperatures and salinity [https://public.wmo.int/en/media/news/argo-ocean-floats-achieve-2-million-profiles-20-years-support-new-research-ocean-heat].
In the two decades to 2019 they had produced some 2 million profiles of conditions in the world’s oceans and showed that the oceans are warming faster than previously estimated. Projects are underway to test floats that can descend to a depth of 6,000 metres, to add sensors that measure biogeochemical (BGC) variables like oxygen, pH and nitrate, and to expand further into seasonally ice-covered seas. Ocean acidification, deoxygenation, and ecosystem health will come into Argo’s gaze through BGC-Argo.
Reference:
[1] A qualification to this estimated number of surface weather stations, NASA states that it’s analysis “incorporates surface temperature measurements from more than 26,000 weather stations and thousands of ship- and buoy-based observations of sea surface temperatures.” [https://www.giss.nasa.gov/research/news/20210114/]