
Sources of data on global temperatures:
In recent times, global temperatures are monitored very closely by the World Meteorological organization from weather stations around the world – see section “How Global Temperatures are Measured or Estimated”
The data from these various sources are monitored and averaged by multiple organizations and provided publicly for comparison. These organizations include NASA’s GISS (Goddard Institute for Space Studies); NOAA (National Oceanic and Atmospheric Administration) National Climatic Data Center (NCDC); the UK Meteorological Office Hadley Centre at the Climatic Research Unit (HadCRU) at the University of East Anglia in the UK; the European Centre for Medium-Range Weather Forecasts (ECMWF); and the Japanese Meteorological Agency (JMA). The University of Huntsville, Alabama (UAH) also participates.
The approach is to map the world into multiple-degree grid boxes (most sources use a 5 degree by 5 degree latitude/longitude grid, but GISS uses 2 by 2 degrees) to create averages (www.carbonbrief.org/profiles/global-temperatures). The Europeans (ECMWF) uses a 30 km grid, with 137 layers up to a height of 80 kms. The Japanese JRA-55 uses about 55 km resolution (TL319), with 60 levels up to 0.1 hPa.
There are obviously areas of the globe where weather stations are absent, or rare (the Arctic, Antarctica, the African interior). Different organizations treat these gaps differently. NOAA’s NCDC interpolates across these gaps, whereas earlier versions of HadCRU does not (HadCRUT5 includes two versions, one of which does). Hence there may be small differences in annual averages (see graph below). NASA GISS state that GISTEMP is “accurate to within 0.1 degrees Fahrenheit with a 95 percent confidence level for the most recent period.” [https://www.giss.nasa.gov/research/news/20210114/].
The trend data are not usually presented at absolute temperatures, but anomalies from and average for a period usually 30 years. This reference period generally moves up as time passes. The graphs and tables from NASA GISS are updated every month. The GISS data are available from the Global Change Master Directory (http://gcmd.nasa.gov). The NOAA NCDC datasets are available from the National Climatic Data Center (https://www.ncdc.noaa.gov/sotc/global/).
GISS uses 1951-1980; HadCRU uses 1961-1990; and NCDC uses the whole of the 20th century as reference period. The satellite data has only been collected since 1978. For general climate change indicators, sources include: http://climate.nasa.gov/key_indicators/ and http://mynasadata.larc.nasa.gov/global-climate-change/.
Global temperature trends:
NOAA: “The 10 warmest years on record have occurred since 2005”.
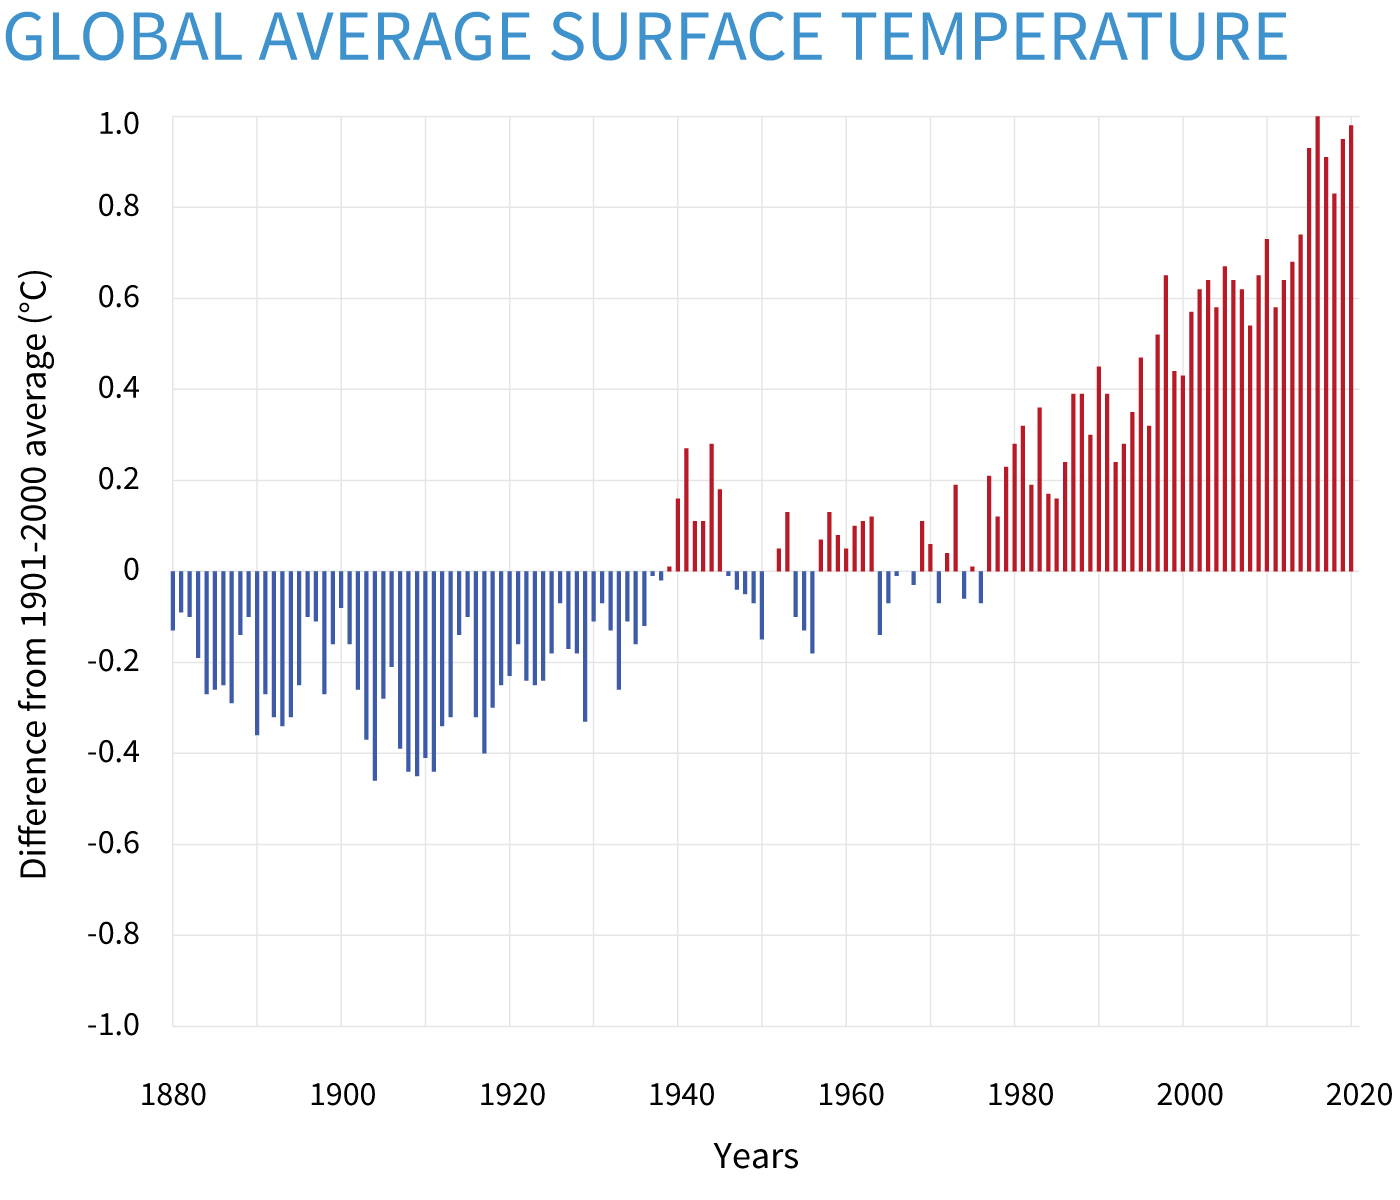
“Averaged across land and ocean, the 2020 surface temperature was 1.76 F (0.98 C) warmer than the twentieth-century average of 57.0 F (13.9 C) and 2.14 F (1.19 C) warmer than the pre-industrial period (1880-1900).” See graph below for trend 1880-2020.
According to NOAA’s National Centers for Environmental Information (NCEI) 2020 Global Climate Report every month from January to November was in the top four warmest on record, [https://www.ncdc.noaa.gov/sotc/global/202013]. December was only (!) the eighth warmest as La Nina provided some cooling effect in the Pacific Ocean. Many parts of Europe and Asia experienced record warm temperatures, including the higher latitudes of parts of Scandinavia, Russia, SE China, and even the Antarctic peninsula experienced a record high temperature of 18.4C on February 6th.
(https://climate.gov/news-features/understanding-climate/climate-change-global-temperature).
Yearly surface temperature compared to the 20th-century average from 1880–2020. Blue bars indicate cooler-than-average years; red bars show warmer-than-average years. NOAA Climate.gov graph, based on data from the National Centers for Environmental Information.
 Source: Climate.gov/news-featues/understanding-climate/climate-change-global-temperature
NASA GISS: NASA reports annually in Global Climate Change: Vital Signs of the Planet [https://climate.nasa.gov/].
The main conclusion in 2020: “the last seven years have been the warmest seven years on record”.
“Continuing the planet’s long-term warming trend, the year’s globally averaged temperature was 1.84 degrees F (1.02 degrees C) warmer than the baseline 1951-1980 mean… 2020 edged out 2016 by a very small margin, within the margin or error of the analysis, making the years effectively tied for the warmest on record. Earth’s average temperature has risen more than 2 degrees F (1.2 degrees C) since the late 19th century”.
[https://www.giss.nasa.gov/research/news/20210114/].
The GISTEMP analysis suggested that the Australian bushfires which burned 46 million acres of land and released smoke more than 18 miles up into the atmosphere, blocked sunlight and cooled the earth slightly. Also, the Covid-19 pandemic shut down some economic activity which reduced annual carbon dioxide emissions slightly, though cumulative concentrations continued to rise.
Geographically, global warming trends are greatest in the Arctic which is warming three times faster than the rest of the planet over the past thirty years. The decrease in area of Arctic sea ice, declining at around 13% per year, results in loss of the albedo (sunlight) reflective effect so ocean temperatures rise faster than in earlier times. “This phenomenon, known as Arctic amplification, is driving further sea ice loss, ice sheet melt and sea level rise, more intense Arctic fire seasons, and permafrost melt.” [ibid].
 As mentioned, 2020 was the second warmest year on record, but only 0.02C less than 2016, the warmest year on record.
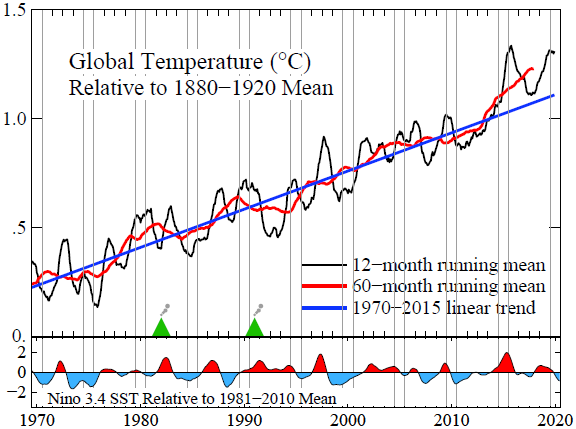
Indeed, the accompanying graph by James Hansen and Makiko Sato shows a distinct uptick in the past 5 plus years in both the 12- and 60-month running means.
Source: Columbia U. ‘Global Warming Acceleration’, Hansen & Sato, published December 14, 2020.
Consistency across data sets:
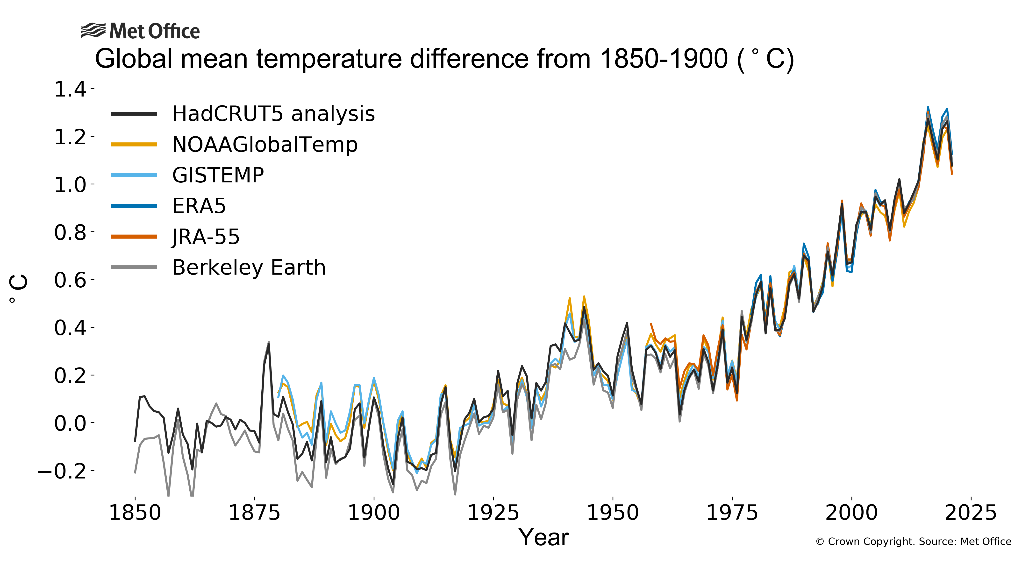
The following graph from the UK Met Office, taken from WMO shows that the trends across the main six datasets have been remarkably similar, at least since about 1970. Many of these datasets have been recalculated in recent years and are now almost universally consistent in showing that average global (land and ocean) temperatures have risen by 1.1 degrees C since pre-industrial times.
(https://public.wmo.int/en/media/press-release/wmo-confirms 2019-second-hottest-year-record)
Seasonality:
The following graph of monthly temperatures in the northern hemisphere presents steadily rising averages evenly across all 12 months, from 1880-1909 (blue), 1910-1939 (dark green), 1940-1969 (light green), 1970-1999 (orange) to 2000-2021 (red).
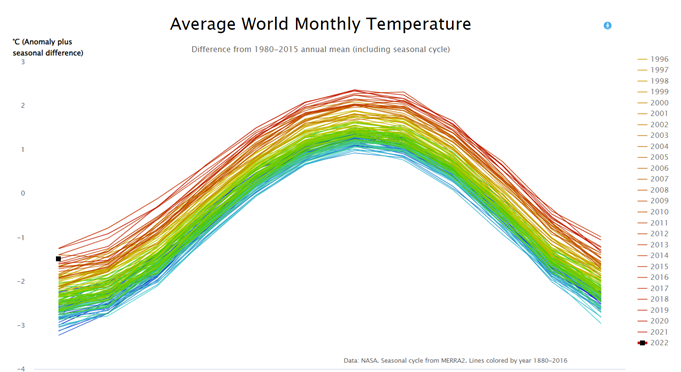
Source: https://graphs.unepgrid.ch/graph_global_temperature_monthly.php
Historical Temperature Trends:
Scientists have recreated a record going back hundreds of thousands of years for temperatures and carbon dioxide levels from ice cores (up to 3 kms deep) drilled into the Vostok base (400,000 years), and later Dome C (800,000 years) in East Antarctica, among other locations (Greenland – past 130,000 years, for example). These trends are accepted as reasonably reflecting global trends over the period. Temperatures are estimated using ratios of isotopic fractions of oxygen (16O) and heavier oxygen (18O), and hydrogen (1H) deuterium (2H) which are temperature-dependent [https://cdiac.ess-dive,lbl.gov/trends/temp/domec/domec.html]. Carbon dioxide levels can be measured more directly in the trapped air bubbles in the ice cores.
Over the past four hundred thousand years, the average temperature of the world has oscillated from minus 8C or 9C during the Ice Ages, to 2C or 3C above present-day averages during the Interglacial periods. These oscillations coincided to a remarkable degree with global levels of carbon dioxide (see graph), which ranged from around 180 to 280 parts per million (0.018-0.028%).
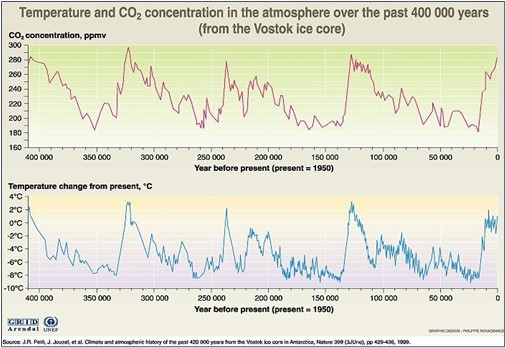
Source: GRID Arendal, UNEP.
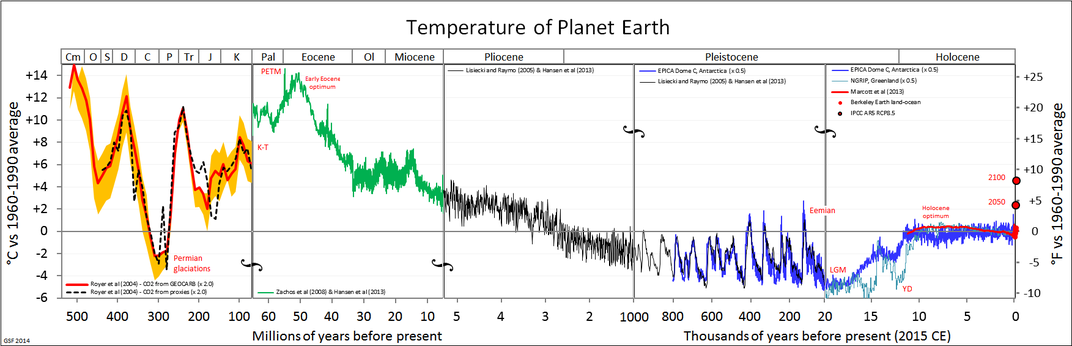 As an aside, there are estimates of global temperature trends going back 500 million years, using the same ratios, but in foraminifera, and other shells. Foraminifera, single-celled organisms roughly the size of the period ending this sentence, occur nearly everywhere in the oceans and have an exquisite fossil record. This suggests that the global temperature has been as much as 14 degrees C higher than at present.
[https://www.smithsonianmag.com/blogs/national-museum-of-natural-history/2018/03/23/heres-how-scientists-reconstruct-earths-past-climates/]
Projections of Global Temperatures:
Future trends in global temperatures will depend on the momentum built in to the atmosphere from past GHG emissions, and also future emissions, plus some natural climate variability. The fifth assessment report of the IPCC in 2014 used four RCPs (Representative Concentration Pathways) all of which showed similar trends up to 2035 – around 0.3C to 0.7C higher than 1986-2005 average levels. However, after that the RCP paths will diverge with all exceeding an increase of 1.5C by century end (2100).
The likely ranges of temperatures by 2100 are for the most optimistic RCP, 2.6 to be 0.3C to 1.7C. For RCP 4.5, 1.1C to 2.6C, for RCP 6.0, 1.4C to 3.1C, and for the most pessimistic RCP, 8.5, 2.6C to 4.8C (AR5 SPM, page 10). These potential temperature increases will ‘virtually certainly’ result in more frequent hot temperature extremes, and fewer cold extremes, on daily and seasonal timescales, so heat waves will occur with higher frequency and longer durations (ibid).
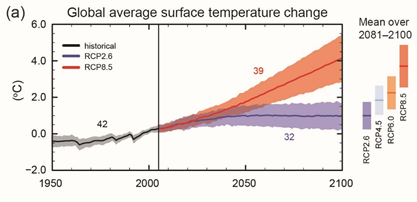
Source: IPCC Graphics AR5 SPM Figure 7.