
The global mean sea level (GMSL) reflects activity in the oceans, and the ice-covered parts of the earth (cryosphere). It is an indicator of long-term trends in these. Changes in GMSL are determined by several processes:
A large proportion of the earth’s fresh water is in the form of ice: in glaciers or in ice sheets in Antarctica and Greenland. As this ice melts it flows into the oceans contributing to sea level rise. If all the glaciers and ice sheets melted, global se level would rise by more than 60 metres (195 feet) [https://sealevel.nasa.gov/understanding-sea-level/global-sea-level/ice-melt]. The sizes of glaciers and ice sheets around the world are continuously monitored by NASA using twin GRACE satellites (2007 to 2017), and the GRACE-Follow On satellite since 2018.
Glaciers outside of the ice sheets account for only about 1% of total ice on land, but a larger amount of sea level rise (SLR). In the past century almost half of SLR has been caused by melting of mountain glaciers. These glaciers continue to melt, and if they melted completely would contribute some 40 cms to SLR [ibid].
As global warming increases the temperature of the atmosphere, more than 90 percent of that trapped heat is absorbed by the oceans [https://sealevel.nasa.gov/understanding-sea-level/global-sea-level/thermal-expansion]. As described in the section on Global Temperatures, the temperature of the oceans is monitored by ships, satellites and drifting sensors – Argo buoys, which measure upper and lower ocean temperatures. Since satellite altimeters were introduced in 2004, about one third of global SLR has been due to thermal expansion of the oceans.
The amount of water on Earth does not change, but the amount in the oceans can change with the water cycle. For example, during the 2010-11 La Nina cycle, heavy rains fueled by evaporation of sea water fell over SE Asia, Australia and the Amazon Basin resulting in a 1 cm drop in GMSL [https://sealevel.nasa.gov/understanding-sea-level/global-sea-level/land-water-storage]. Rainwater can also be trapped on land by dams. Such water captures are equivalent to about 3 centimeters of sea level, or a recent decade of SLR [ibid]. On the other side of this equation, human extraction of underground water from aquifers can eventually return to the oceans, adding to SLR.
Regional Relative Sea Level Change:
While changes in global sea levels are important indicators of the long term planetary trends, it is regional relative sea level changes which are important when impacts on coast lines, for example [https://sealevel.nasa.gov/understanding-sea-level/regional-sea-level/overview]. These regional SL changes are affected by (i) short-term effects such as storm surges, ocean tides, and freshwater inputs; (ii) sterodynamic variability due to ocean circulations (ENSO, NAO, PDO), temperature and saltiness; (iii) glaciers, (iv) land water storage; (v) ice sheets, and (vi) subsidence.
It is now possible to track sea-level changes anywhere with NASA’s new SEA tool (Sea Level Evaluation & Assessment Tool) [https://sealevel.nasa.gov/sea-level-evaluation-tool]. For example, at the time of writing, the rate of SLR is 3.92 mm/year at the northern end of the Bay of Bengal, with considerable variation away from the coast.
There are some other useful tools on this website:
Measurement of global sea levels:
Sea levels were measured historically around the world by tide gauges, with either manual or automatic sensors. Since about 1993, sea level has been measured from space by satellite radar altimeters, which determine the height of the sea surface by measuring the return speed and intensity of a radar pulse directed at the ocean [https://www.oceanservice.noaa.gov/facts/sealevel.html]. The faster and stronger the return signal is, the higher the sea level.

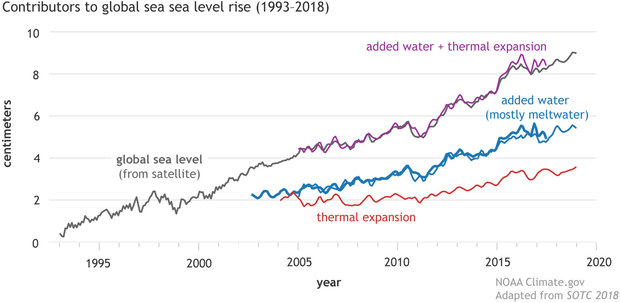
In the accompanying graph, the dark blue line shows a steepening upward curve reflecting the acceleration of global SLR, while the light blue shaded area shows the 95% confidence intervals on these tide gauge estimates. The orange line shows, since 1993, satellite estimated levels, which are somewhat lower in the past few years.
Source: https://www.globalchange.gov/browse/indicators/globa-sea-level-rise
Global Sea Level Trends:
 Since global records started in 1880, global sea levels have risen, on average, 21-24 centimeters. The rate of SLR has been increasing. In this 140+ year period, one third of the increase has occurred in the past two and a half decades.
In a recent decade (2006-2015) SLR was 3.6 mm/year, compared to 1.4 mm/year throughout most of the 20th century. In 2020, sea levels reached a record height of 91.3 mm above 1993 levels.
The accompanying graph shows that thermal expansion of the oceans has contributed a sizeable amount to SLR, but rather less than added water from melting ice.
Source: as for previous graph.
The following table shows the breakdown of sea level rise over the recent period (1993+) using only satellite data, and the long term, back to 1900, where tide gauges were the source.
The total sea level rise is the sum of steric sea level, which basically means thermal expansion, plus ocean mass, which derives from melt water from Antarctic and Greenland ice sheets plus mountain glaciers, minus land water storage or capture.
Over the long term, since 1900, the rate of sea level rise has averaged 1.56 mm/year, of which one third was due to thermal expansion and two-thirds were due to added water. The pattern over the short term, since 1993 or later, is the same, though the level of SLR is more than double, at 3.34 mm/year.
It may be noted that the numbers for components of ocean mass add up for the long term, but not the shorter term. Note that the contributions from melting ice sheets in the Antarctic and Greenland are based on change in mass of ice. With the conversion factor of sea levels rising 1 mm for every 360 gigatonnes (Gt) of ice melted. As shown earlier the satellite estimates are slightly lower than the tide gauges for recent years, so these differences in recent estimates might reflect that.
| SHORT-TERM/RECENT | LONG-TERM |
TOTAL SEA LEVEL | 3.34 (1993-2020) | 1.56 (1900-2018) |
STERIC SEA LEVEL (Thermal Expansion) | 1.10 (2005-2019) | 0.52 (1900-2018) |
OCEAN MASS* (Ice/Water added) | 2.10 (2002-2020) | 1.00 (1900-2018) |
*Greenland | 0.78 (2002-2020) | 0.44 (1900-2020) |
*Antarctic Mass Loss | 0.41 (2002-2020) | 0.08 (1900-2020) |
*Glacier Mass Loss | 0.57 (2002-2016) | 0.70 (1900-2018) |
LAND WATER STORAGE | -0.33 (2002-2016) | -0.21 (1900-2018) |
Latest measurement: May 2019: 94 (+ 4) mm
This is the Global Mean Sea Level (GMSL) from the Integrated Multi-Mission Ocean Altimeter Data for Climate Research. The GMSL is a time series of globally averaged Sea Surface Height Anomalies (SSHA) from TOPEX/Poseidon, Jason-1, OSTM/Jason-2 and Jason-3.
The Bay of Bengal is among the slowest rising sea level regions (~2-2.5 mm/year). But recent evidence suggests these rates are accelerating as Arctic and Antarctic ice is melting faster than earlier models predicted.
 Satellite Data: 1993-Present. Rate of change up to 3.3 mm/year
Credit: NASA Goddard Space Flight Center
For over 20 years, satellite altimeters have measured the sea surface height of our ever-changing oceans. This image shows the 20 year trends of rising seas across the globe from 1993 to 2016. The grids and figures were produced at the Jet Propulsion Laboratory (JPL), California Institute of Technology, under the NASA MEaSUREs program (version JPL 1603).
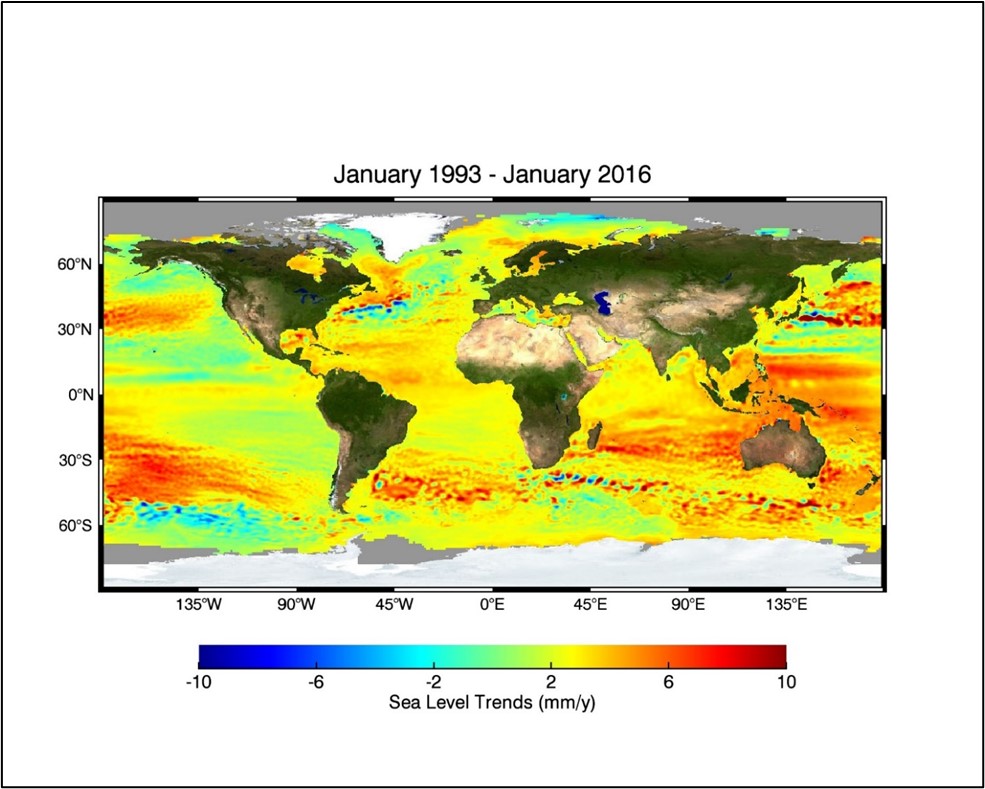 It is clear that SLR has been quite variable with higher levels in the Pacific Ocean, and relatively lower levels in much of the Bay of Bengal.
Although the new NASA Sea Level Tool indicates that there is also considerable variation across current estimates within the Bay – from 1 to 5 mm/year.
Regional sea levels:
The NASA SEA (Sea Level Evaluation & Assessment) Tool [https://sealevel.nasa.gov/data_tools/16/] allows an instant reading of sea level change. It covers the period 1993 when satellite measurements began, to 2019.
In most places sea levels have been rising but, as mentioned earlier, due to differences in ocean currents, vertical geological changes in coastlines, and changes in gravitational forces, sea levels do not rise equally everywhere.
There are other data tools under the NASA Sea Level Change portal [https://sealevel.nasa.gov/data/tools]. These include:
From the NOAA Office for Coastal Management there is a Sea Level Rise Viewer which helps to visualize community-level impacts from coastal flooding or sea level rise (up to 10 feet above average high tides) [https://coast.noaa.gov/digitalcoast/tools/slt.html].
Projections of Future Sea Level Rise (SLR)
Firstly, according to the latest assessment report of IPCC, the AR6, and using their terminology, it is virtually certain that GMSL will continue to rise during this century.
Relative to a baseline from 1995-2014, the GMSL by 2100 is likely to have risen by 0.28-0.55 m under the very low GHG emissions scenario (SSP1-1.9), 0.32-0.62 m under the low GHG emissions scenario (SSP1-2.6), 0.44-0.76 m under the intermediate GHG emissions scenario (SSP2-4.5), and 0.63-1.01 m under the very high emissions scenario (SSP5-8.5).
By 2150 the levels are projected (with medium confidence) to be 0.37-0.86 m under SSP1-1.9, 0.46-0.99 m under SSP1-2.6, 0.66-1.33 m under SSP2-4.5, and 0.98-1.88 m under SSP5-8.5. [https://www.ipcc.ch/reports/ar6/wg1/#SPM], page 28.
Admittedly some projections of GMSL are with low confidence, but due to the uncertainty in Antarctic and Greenland ice sheet stability, GMSL might rise to 2 m in 2100 and 5 m in 2150 under a very high emissions scenario (SSP5-8.5).
In particular, there is concern about the West Antarctic ice sheet (WAIS), a huge slab of ice that lies partially below the sea surface and rests on bedrock that slopes downward towards the Southern Ocean. If the WAIS becomes unstable and slides into the ocean, it would add roughly 3 meters to global sea levels [https://earthobservatory.nasa.gov/images/148645/the-known-unknows-of-sea-level-rise].
In the very long term, sea level is expected rise for centuries to millennia due to continuing deep ocean warming and ice sheet melt [ibid SPM-28]. Over the next two millennia, GMSL will rise, under the most optimistic circumstances, where warming is limited to 1.5C, to 2 to 3 m. If, as seems probable, warming rises to 2C, then GMSL will rise to 2 to 6 m, and to 19 to 22 m under the worst-case scenario (SPP5-8.5). These estimates are based o historical data of sea levels and global temperatures during past warm periods.
As mentioned earlier, making local or regional projections of sea level rise is very difficult as it will be affected by many competing factors. Among them:
“the rising and falling of the land surface due to tectonic and human activity; gravity anomalies that can create regional bulges and dips in sea surface height; variations in temperature and salinity of seawater; changes in the amount of water stored on land in reservoirs; isostatic adjustment due to the addition, loss, and movement of land ice; and changes in erosion and how much sediment rivers carry to coastal areas.”
[https://earthobservatory.nasa.gov/images/148494/anticipating-future-sea-levels].
There have been gaps in how the land masses are moving vertically, and otherwise. But some of these gaps in ‘land motion’ data will be filled with the launch of the NASA-ISRO Synthetic Aperture Radar (NISAR) mission in 2022. The radar will make daily global measurements of land motion that will lead to major improvements in regional sea level rise projections. [ibid].
It is worth noting that wealthier countries are already investing in ‘elaborate sea walls and water-control systems that protect vulnerable deltas like the Rhine and the Sacramento-San Joaquin…… In other deltas, like the Krishan or Ganges (India), the Chao Phraya in Thailand, and the Mekong in Vietnam, coastal defenses are more limited so far’ [ibid].
Resources for projecting potential impacts of sea level rise:
Climate Interactive [https://www.climateinteractive.org] has developed software, En-ROADS, which estimates global sea level rise throughout the 21st century. It uses the methods proposed by Vermeer and Rahmstorf which link changes in global temperatures directly with sea level rise. The En-ROADS software estimates 1.15 metres of SLR during the 21st century, rather more than the most pessimistic SSP5-8.5 scenario from the IPCC AR6.
One of the important components of the software is the Flood Risk Map which uses Google Earth to map out flood risks for any location in the world. This uses Climate Central’s digital elevation model, CoastalDEM [https://go.climatecentral.org.coastaldem/]. According to Climate Interactive, the SLR flood risk maps indicate the land which is expected to be below the high tideline due to SLR in future climate change scenarios [https://climateinteractive.org/project-news/sea-level-rise-maps-are-now-in-en-roads].